Entry model two can be used as both a trend reversal and trend continuation pattern on any time frame, as long as you are aligned with the price direction.
Trend Reversal Entry Model 2 Example
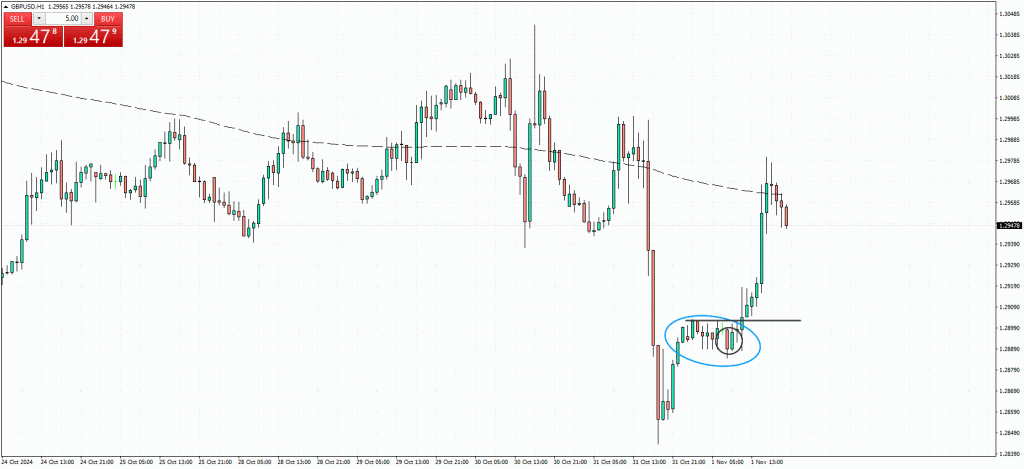
In the following example on the GBP/USD H1 time frame, this model illustrates a trend reversal, where the price moves away from the SMA200. After a significant move away from the SMA200, the price will often return at some point.

As shown, after a major move, the price begins to reverse, but caution is required under these market conditions. Once the price starts consolidating (indicated in the blue circle), we observe the consolidation over 5 or more candles. We should enter the trade once one of the candles surpasses all previous candlesticks in the consolidation area (blue circle). This occurs when a candle body closes above all prior candlesticks, specifically above the horizontal gray line on the chart below.
Important: The price will usually retest this breakout. You can use smaller time frames to enter the trade after the retest for a more precise entry and better risk-reward ratio. In other words, this approach helps reduce your risk by minimizing it.
After this breakout candle, we should enter the trade. This setup can be considered a form of consolidation breakout entry model.
I highlighted this pattern with a circle, as it’s one of my preferred setups and gives me additional confidence that I’m on the right side of the market.
Continuation Entry Model 2 Example
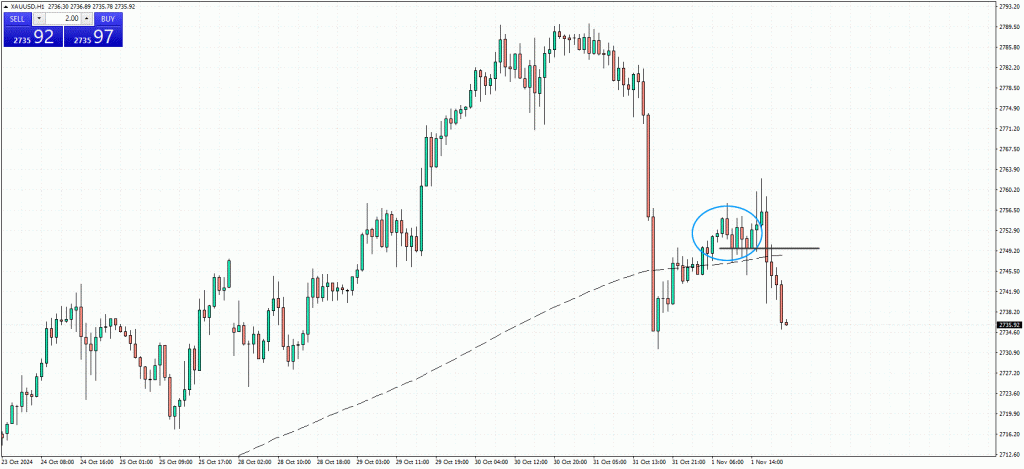
XAU/USD at H1 time frame. The image below shows bearish trend for gold. Our goal should be to trade in the direction of the trend.

We are using the same rules mentioned above in the first example. Once a candle outperforms all previous candlesticks in the consolidation area (blue circle) and its body closes below them (the candlestick that breaks the horizontal support gray line), we can enter the trade. Again, the smart approach is to wait for the price to retest this level (support) and then enter for a more precise entry to minimize risk.
The candlestick body breaks below the SMA200 and closes beneath it, which further indicates a return to a bearish trend—this is additional confirmation. You don’t have to use the MA, but I personally find it helpful.
