
Japanese Candlestick Explanation
- Definition: Japanese candlestick is a price chart in trading platforms. They are used to display prices for a certain period. They are showing open, close, high, and low in a specific period.
Explained
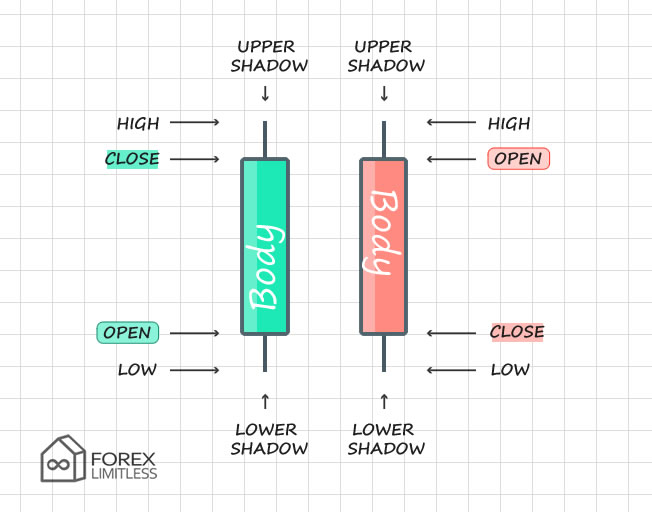
- If the price closes above the open, then we have to buy a (long) candlestick. On our charts, it is a green candle.
- If the price closes below the open, then we have to sell a (short) candlestick In our examples it is the red candlestick.
- The center (filled part) is called the body.
- Thin lines up and down are called shadows.
- The upper shadow is high (the highest price reached in that period)
- Lower shadow represents low (the lowest price in that time frame).
There are three main categories of Japanese Candlestick Patterns.
- Bullish Reversal Candlestick Patterns.
- Bearish Reversal Candlestick Patterns.
- Continuation Candlesticks.
Bullish Reversal Patterns
- Hammer
- Piercing Pattern
- Bullish Engulfing
- The Morning Star
- Three White Soldiers
- White Marubozu
- Three Inside Up
- Bullish Harami
- Tweezer Bottom
- Inverted Hammer
- Three Outside Up
- On Neck Pattern
- Bullish Counterattack
Bearish Reversal Patterns
- 14. Hanging man
- 15. Dark Cloud Cover
- 16. Bearish Engulfing
- 17. The Evening Star
- 18. Three Black Crows
- 19. Black Marubozu
- 20. Three Inside Down
- 21. Bearish Harami
- 22. Shooting Star
- 23. Tweezer Top
- 24. Three Outside Down
- 25. Bearish Counterattack
Continuation Patterns
- 26. Falling Three Methods
- 27. Rising Three Methods
- 28. Upside Tasuki Gap
- 29. Downside Tasuki Gap
- 30. Mat Hold
- 31. Rising Window
- 32. Falling Window
Neutral Candlesticks Patterns
- 33. Doji
- 34. Spinning Top